The Insights tool generates tables and graphs showing the number and percentage of documents that are associated with different data points within the selected/saved results set.
Multiple options to access Insights are available and it is possible to analyze search sets or selected records either by selecting the records of relevance from the results list or by adding them to the Saved list.
Accessing Insights
Accessing Insights from the Timeline
Click on the three dots at the right of the relevant search query then select Explore insights
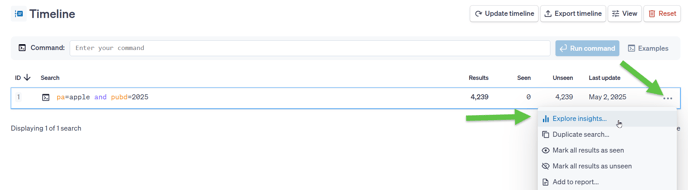
Please note that if the Insights are accessed from the Timeline, the selected search set will load in the background.
Accessing Insights from within the search results page
Click on the Actions button in the top left hand corner then select Explore insights
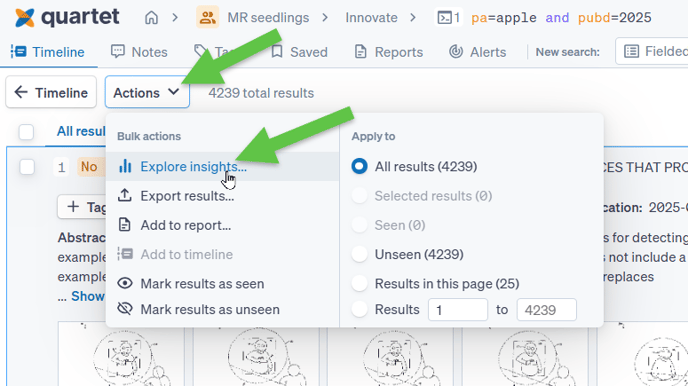
Use the tick boxes to the left of individual records to include only the selected records in Explore insights.
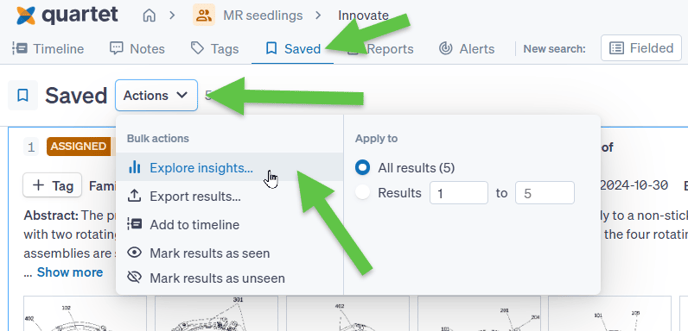
Accessing Insights from the Saved list
Navigate to the Saved list along the top of the page, click on the Actions button then select the Explore insights option
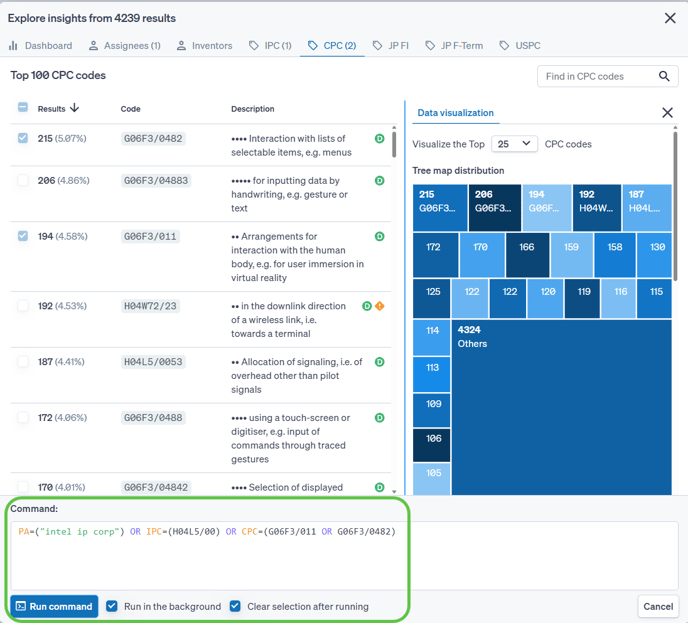
Explore Insights
Once within the Insights, tabs are presented along the top of, first the Dashboard followed by the individual data points like Assignees, Inventors and Classifications.
The Dashboard will show Top 10 for each data point, represented in different bar charts:
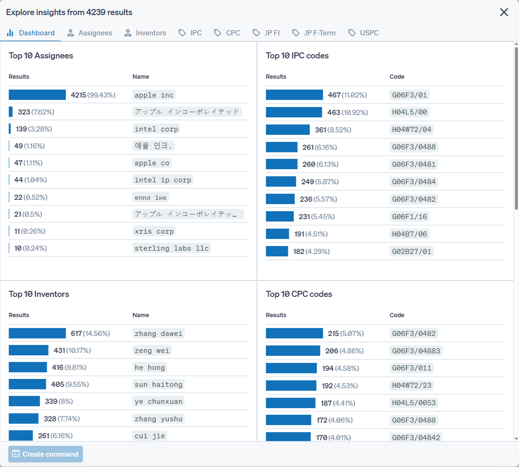
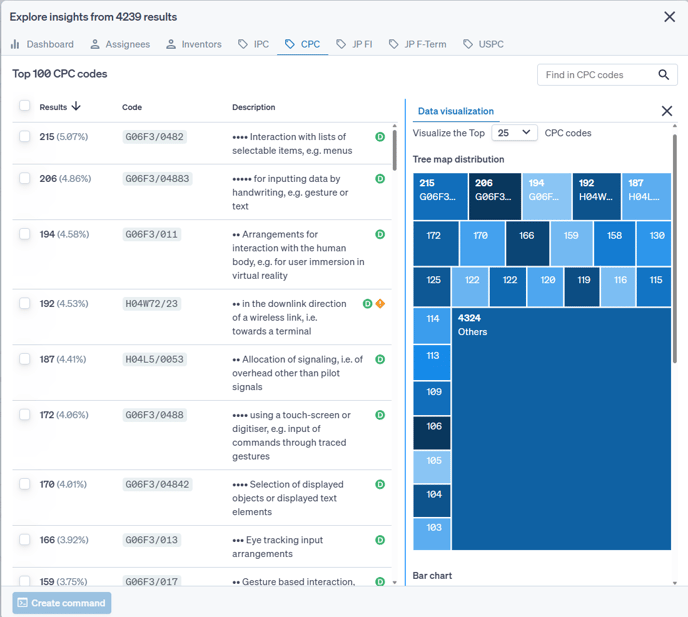
On the individual data point tabs, information is displayed in two columns, within the left hand side column the Top 100 data points for the selected tab is displayed along with a count of records and the percentage they represent in the search set. It is possible to change the order from descending to ascending by clicking on the arrow found at the top by the Results column.
Please note that if a search set is larger than 10.000 hits, only the first 10.000 records are included in the Insights.
For any classifications, hover over individual codes to show the full classification tree popup similar to hovering over classification codes in other views.
Within the right hand column, data visualizations are displayed, at the top a Tree map and below a Bar chart.
By default the visualizations display the top 25 data points, however it is possible to change this from the drop down option at the top.
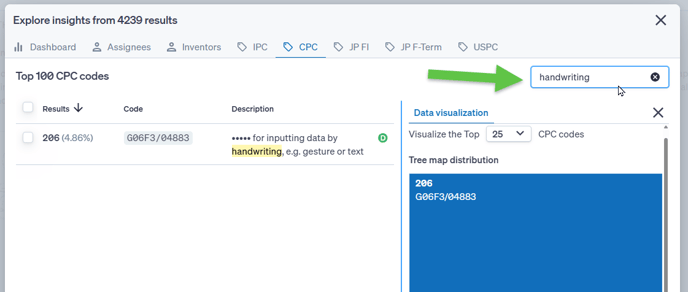
In the very top right hand corner a search box is available, using this will filter through information available within the Insights function and only display matching data points. It is possible to use assignee, inventor, classification codes or descriptions of classification codes.
Data within the 2 columns will automatically update to only show what is matching the filter criteria:
To save any of the visualizations, for the moment, it is only possible to do so by creating screenshots.
Creating a search from Insights
Within each data point tab, options can be selected to be added in the “Create command” box found in the bottom left of the screen. It is possible to include data from multiple tabs. If data from multiple tabs is included, they are by default combined with Boolean operator OR, however it is possible to edit the search before running, should another Boolean operator be needed.
Once the command has been created, it is possible to run in the background, whereby the search will be populated in the Timeline and the Insights can be further explored without leaving the page.
Select the Clear selection after running option to be able to create further searches from the Insights.